Abstract
This study combined company-level employee engagement data with earnings per share (EPS) trend data to assess the longitudinal relationship between the two. The findings showed that organizations with a highly engaged workforce exceeded the earnings per share of their competition and widened the gap with competition during the recession. These findings suggest that organizations that continue to focus on improving their workforce’s engagement during a down economy experience greater economic resilience.
Objective
The objective of this research was to study the relationship between organizational-level employee engagement and earnings per share from 2004-2008.
Methods
After reviewing available data, 56 organizations met all of the criteria above. Comparing each organization’s engagement level to Gallup’s 2006/2007 Q12 database, 11organizations were ranked in the top decile (top 10%) of all organizations, 25 were ranked in the top quartile (top 25%),and 31 were ranked below the top quartile. (The top-decile organizations are also included in the top-quartile grouping.)The primary analyses involved comparing 2007 and 2008trends in employee engagement and EPS, using the years2004-2006 as a baseline. The 11 top-decile organizations included responses from 575,409 employees, with a median response rate of 92%. The 25 top-quartile organizations included responses from 882,438 employees, with a median response rate of 90%. And the remaining 31 organizations that ranked below the top quartile of the database included responses from 527,682 employees, with a median response rate of 85%.
Results
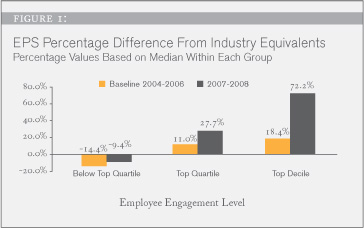 Figure 1 shows the difference in earnings per share for each of the three groups studied compared with industry equivalents. The top-decile organizations are also included in the top-quartile grouping. As such, it is best to compare top-decile or top-quartile companies to organizations scoring below the top quartile, rather than to each other.From 2007-2008, companies in the top decile of employee engagement exceeded their competition by 72% in earnings per share, and top-quartile companies exceeded their competition by 28%. For companies that scored below the top quartile, earnings fell 9.4% below their competition during this same time frame. Top-decile and top-quartile organizations also exceeded their competition at the baseline measure of EPS, which suggests that they were well-run companies at the outset of the study. However, the findings show that having an engaged workforce might accelerate financial improvement relative to competition. From baseline to 2007-2008, the growth trajectory (compared to the competition) for top-quartile organizations was 2.5times, and for top-decile companies, it was 3.9 times.
 Gallup reviewed data from 649 organizations (5.8 million respondents) in Gallup’s 2009 employee engagement database. Of the 649 organizations, 172 were listed as publicly traded. Gallup researchers reviewed existing employee engagement data to find organizations that met the following criteria:
- The majority of the organization (versus partial organization or subsidiary) was surveyed by Gallup,so accurate comparisons could be made to company-level EPS data.
- High response rate for the intended survey population(median of 86%; mean of 85% for this analysis).
- Employee engagement data were available for 2006and/or 2007.
- 2004-2008 earnings per share (EPS) data were available for the organization and its three top industry competitors (to control for industry effects). EPS data were collected from various public sources.
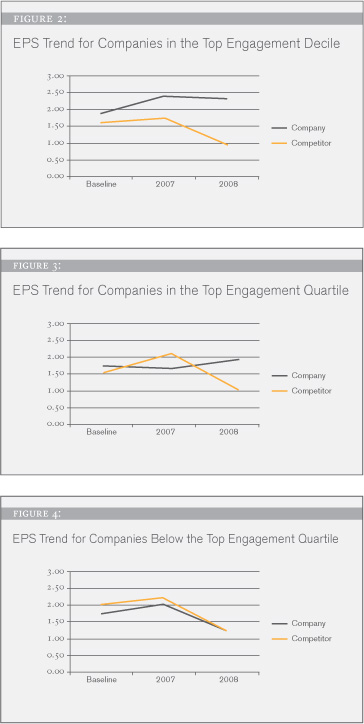
Figures 2 through 4 show the actual median EPS for the three study groups relative to the competition for the baseline (2004-2006) and for 2007 and 2008. This shows the transition during the onset of the recession. When it comes to EPS, organizations with a critical mass of engaged employees appear to have been cushioned from the general downward-trending macro economy. Top-quartile organizations trailed the competition before the recession but surpassed competitors in 2008. Top-decile organizations, while already ahead of the competition at the baseline and in 2007, widened the gap even further in 2008. Organizations that were below the top quartile followed the same downward trend as their competition during the recession.
EPS Trends During a Down Economy
Based on the available 2006-2007 database, organizations with engagement below the top quartile had a ratio of 2.2 engaged employees for every actively disengaged employee. Companies in the top quartile of the database had a ratio of 5.8 engaged employees for every actively disengaged employee. Companies in the top decile of the database had a ratio of 8.0 engaged employees for every actively disengaged employee.
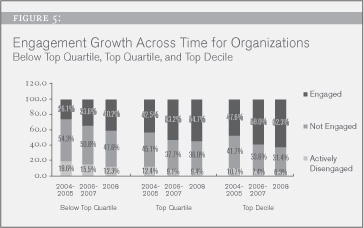 Figure 5 shows the trend of the engagement index over time (2004-2005, 2006-2007, and 2008) for the study groups. It is important to note that all companies included in the analysis are Gallup clients and were working on improving employee engagement during the time of the study. Therefore, growth in engagement was observed for all groups. One of the primary differences between the study groups was the number of Q12 administrations and the length of time each group had been working on improving engagement. Organizations below the top quartile averaged three employee engagement administrations. Those in the top quartile averaged six administrations, and those in the top decile averaged seven administrations.
In terms of the ratio of engaged to actively disengaged employees, organizations below the top quartile improved from a ratio of 1.3:1 to a ratio of 3.3:1. Companies in the top quartile improved from a ratio of 3.4:1 to a ratio of 5.8:1. And those in the top decile improved from a ratio of 4.4:1 to a ratio of 9.9:1.
Conclusion and Discussion
The results of this study, as well as a prior iteration of this same research (Gallup, 2006), show that organizations with a critical mass of engaged employees performed well financially — even in 2008 as the recession began to affect the economy. While earnings per share was negatively affected overall, having an engaged workforce seems to provide a cushion against downward volatility in the market. Top-decile engagement organizations, with an average of 8.0 engaged employees for every actively disengaged employee in 2006-2007, experienced 72% higher EPS compared to their competition in 2007-2008. Organizations scoring below the top quartile, with an average of 2.2 engaged employees for every actively disengaged employee in 2006-2007, experienced 9.4% lower EPS compared to their competition in 2007-2008. These results show that organizations scoring below the top quartile in engagement appear to be more vulnerable during a challenging economy.
Change in EPS relative to the competition was three times more favorable for organizations in the top quartile compared with those below the top quartile. Change in EPS relative to the competition was about 11 times more favorable for organizations in the top decile of engagement compared with those below the top quartile. These organizations in the top-decile have had relatively high engagement for several years, but they have continued to increase their overall level of engagement, recently reaching a ratio of 10 engaged employees for every actively disengaged employee. As the recession set in, top-decile organizations widened the gap between their EPS and that of their competition.
The relationship between employee engagement and earnings per share likely emerges due to the business-unit-level relationship between engagement and numerous performance outcomes. That is, engagement does not directly explain differences in EPS across organizations. Engagement relates to EPS because it predicts many shorter term outcomes that accumulate to influence EPS.
Recent meta-analytic research (Harter, Schmidt, Killham, & Agrawal, 2009) across 32,394 business units illustrates this through the negative relationship between engagement and absenteeism, employee turnover, accidents, merchandise shrinkage, and quality defects and the positive relationship between engagement and customer loyalty/engagement, productivity, and profitability. These relationships are obtained at the business or work unit level. Highly engaged organizations are those with a critical mass of highly engaged business units, which also have a higher probability of positive outcomes (less absenteeism, lower turnover, fewer accidents, less shrinkage/theft, fewer defects, higher customer perceptions, higher productivity, and higher profitability). These outcomes likely accumulate to influence EPS differences and to protect engaged organizations from the negative macro-level effects of the economy.
References
Engagement Predicts Earnings Per Share. (2006). Omaha, NE: Gallup.
Harter, J.K., Schmidt, F.L., Killham, E.A., & Agrawal, S. (2009). Gallup Q12® meta-analysis: The relationship between engagement at work and organizational outcomes. Omaha, NE: Gallup.